Financials
Highlights of the Year
Total revenues rose by 13 per cent due to the realization of capital gains upon the sale and reinvestment of some of the university's endowment investments and an increase in government grants
and contracts.
The university ended the 1999/00 year with an operating surplus
of $2.0 million.
Domestic student tuition fees were frozen for the fourth year in a row at 1996/97 levels.
During the year, the university awarded scholarships, fellowships and bursaries to students totaling $26.3 million.
The university's total assets,
recorded at a book value of $1.5
billion, consists primarily of capital assets and endowment investments.
Endowment Fund at Market Value
(Millions of Dollars)
|
1990
|
$139
|
|
1995
|
$340
|
|
2000
|
$673
|
|
|
 |
Financial Highlights
(April 1,1999 - March 31, 2000)
The University of British Columbia's financial statements for the year ended March 31, 2000 have been reported on by the Auditor General
of British Columbia, the auditor appointed under the University Act. The following represents the highlights of UBC's financial statements for the year ended March 31, 2000:
|
($ millions)
|
|
2000
|
|
1999
|
|
|
Total Revenues
|
$
|
835.7
|
$
|
741.0
|
|
Research Awarded to UBC
|
$
|
166.0
|
$
|
141.0
|
|
Total Endowment Market Value
|
$
|
672.7
|
$
|
601.8
|
|
Operating Surplus (Deficit)
|
$
|
2.0
|
$
|
0.1
|
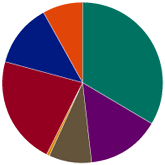
Total Revenues By Source ($836)
For the year ended March 31, 2000
(millions of dollars)
|
 |
 |
Provincial operating grant
|
$
|
280
|
33.5 %
|
 |
Other government grants and contracts
|
$
|
123
|
14.7 %
|
 |
Endowment income
|
$
|
72
|
8.6 %
|
 |
Other investment income
|
$
|
5
|
0.6 %
|
 |
Sales, services and other
|
$
|
182
|
21.8 %
|
 |
Student fees
|
$
|
106
|
12.7 %
|
 |
Non-government grants, contracts and donations
|
$
|
68
|
8.1 %
|
 |
Total
|
$
|
836
|
100.0 %
|
| |
|
|
|
|
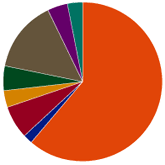
Total Expenses And Transfers ($834)
For the year ended March 31, 2000
(millions of dollars)
|
 |
 |
Salaries and employee benefits
|
$
|
510
|
61.2 %
|
 |
Grants to other agencies
|
$
|
16
|
1.9 %
|
 |
Depreciation
|
$
|
56
|
6.7 %
|
 |
Other transfers
|
$
|
28
|
3.4 %
|
 |
Transfer to endowment principal
|
$
|
42
|
5.0 %
|
 |
Supplies and expenses
|
$
|
122
|
14.6 %
|
 |
Cost of goods sold
|
$
|
34
|
4.1 %
|
 |
Student awards
|
$
|
26
|
3.1 %
|
|
|
|